EXPERIMENT NO. 12
AIM
:- To studyAPPARATUS :- a solar pannel, a voltmeter, a micro-ammeter, a decade restor box and a 100 W lamp fitted with an intensity control.
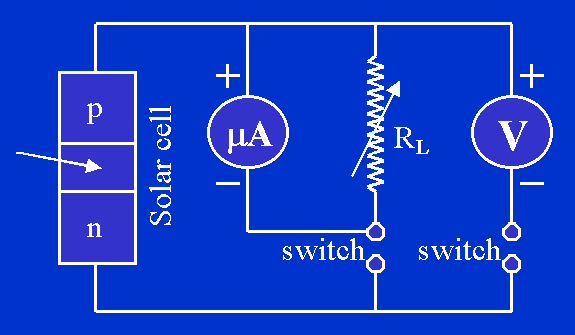
CIRCUIT DIAGRAM:-

PROCEDURE:-
OBSERVATIONS:-
Observation Table 1 - Illumination characteristics (with voltage switched off and current switched on)
|
Intensity (Volts) |
Current (micro-amps) |
|
0 |
|
|
RL (k ohms) |
Intensity I1 (0 Volts) |
Intensity I2 (100 Volts) |
Intensity I3 (130 Volts) |
|||
|
Voltage (Volts) |
Current (micro-amps) |
Voltage (Volts) |
Current (micro-amps) |
Voltage (Volts) |
Current (micro-amps) |
|
|
0.47 |
|
|
|
|
|
|
|
RL (k ohms) |
Intensity I1 (0 Volts) |
Intensity I2 (100 Volts) |
Intensity I3 (130 Volts) |
|
Power (micro watts) |
Power (micro watts) |
Power (micro watts) |
|
|
0.47 |
|
|
GRAPH:-
1. For ILLUMINATION CHARACTERISTICS, a graph is plotted between the current and intensity (intensity is taken as proportional to the voltage given to the lamp).
2. For V-I CHARACTERISTICS, a graph is plotted between the current and voltage.
3. For P-RL CHARACTERISTICS, a graph is plotted between the power and load.
RESULT:-
1. When voltage across solar cell is switched off, the current is found to vary linearly with the intensity.
2. The maximum power output is found to be mW.
3. The optimum load is found to be k-ohms.
PRECAUTIONS:-
1. The terminals of the solar cell are to be correctly connected.