
EXPERIMENT NO. 6
AIM
:- Use of a single trace cathode ray oscilloscope (C.R.O.)APPARATUS
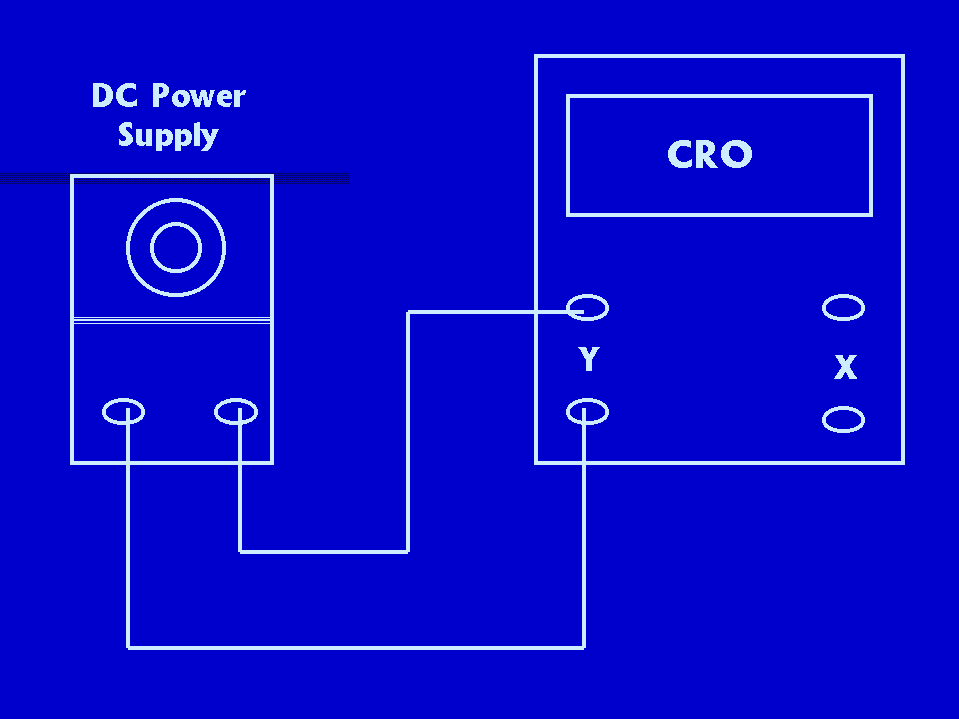
:- A single trace cathode ray oscilloscope (C.R.O.), a d.c power supply, a a.c. voltage generator.CIRCUIT DIAGRAM:-
PROCEDURE:- a) MEASUREMENT OF DC VOLTAGE.
One end of the cable is connected to Y plates of CRO and other end of cable is connected to DC power supply taking care that the positive lead of the cable is connected to the positive terminal and the negative to the negative terminal of the dc power supply. Verticle amplifier control (volts/cm) is set at 1 V/cm and the DC power supply is switched on. The output voltage of the power supply is varied and its effect on the trace is noticed. The trace moves up with increase in voltage and moves down with a decrease in voltage. The Y-amplifier control is kept in a chosen best setting and dc voltages of random magnitudes are applied to the CRO. The amount of deflection in terms of number of divisions on the graticule are noted. By multiplying the number of divisions (volts/cm), the value of the DC voltage applied is determined. The measurements are recorded in Table. At every stage, the measurement is counter-checked by seeing the actual DC voltage values. The DC supply is switched off. The connections to its terminals are reversed. The power supply is switched on. When the voltage is varied, it is seen that deflection of the trace occurs now in the direction opposite to that in the earlier case. The trace moves downwords. The measurement procedure described earlier is repeated and the readings are recorded in table. The measurements are counter-checked by observing the actual voltages.
b) MEASUREMENT OF FREQUENCY OF AC VOLTAGE
The output terminals of AC voltage generator are connected to Y plates of CRO such that the positive lead of the cable is connected to the positive terminal and the negative to the negative terminal. The time base control is suitably adjusted so as to get about 2 to 3 cycles of the signal displayed on the screen. The length of one cycle on the gratitude is read. It is multiplied by the time base setting (ms/cm or micro sec/cm) to obtain the time period of the signal. From the time period the frequency is determined. The measurements are recorded in table. The measurements are then counter-checked by observing the actual frequency values.
OBSERVATIONS:-
a) MEASUREMENT OF DC VOLTAGE.
|
Sr. No. |
Position of Vertical Amplifier control (volts/cm) |
Displacement D |
DC voltage |
Actual voltage shown by DC power supply. |
|
1 |
b) MEASUREMENT OF FREQUENCY OF AC VOLTAGE
|
Sr. No. |
Time Base |
No. of Horizontal Divisions |
Period, T |
Frequency, f |
Frequency read on dial of AC generator |
|
1 |
RESULT:-
Our calculated results are nearly equal to observed results.
PRECAUTIONS:-