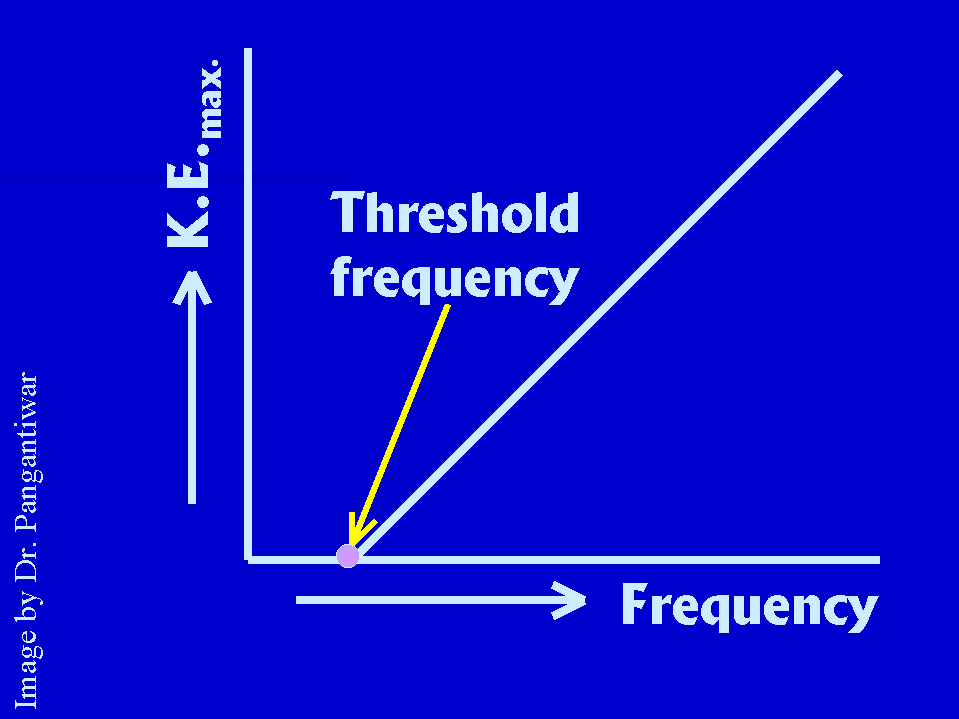
A sketch showing the variation of kinetic energy of electrons with frequency of the incident radiation

in a photoelectric effect experiment is shown in figure, which is a straight line. The plot intersects the frequency axis at threshold frequency, because the kinetic energy of photo-electron is equal to zero at threshold frequency. Above threshold, the K.E. of photoelectrons is directly proportional to the frequency of incident light, as the sketch is a straight line.
According to quantum theory
Energy of photon = Energy needed to liberate the
electron + Maximum K.E. of the liberated electron.
i.e., h (frequency) = W0 + 1/2 m [v2max]
i.e., K.E.max = h (frequency) - W0
The above equation is the equation of a straight line, so our plot is a straight line.
and when K.E.max = 0
h (frequency) = W0 = h (threshold frequency)
i.e. (frequency) = (threshold frequency)
So, our plot intersects the frequency axis at threshold frequency.

Thus, quantum theory provided satisfactory explanation of the features shown on the plot drawn by us.

==============
By :-   Dr. A. W. Pangantiwar